 Chinese
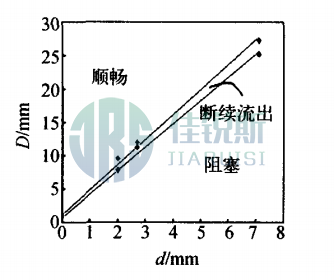

Study on Granular Flow Rate and Its Influencing Factors in Three-dimensional Funnels
Abstract: Sand clock experiments in three-dimensional funnels were conducted to investigate changes in granular flow rate under varied particle sizes, funnel orifice dimensions, and inclination angles. Relationships between flow rate versus funnel inclination angle and particle size were fitted using Matlab software, and qualitative interpretation provided for experimental phenomena.
1.Introduction
Granular materials broadly refer to assemblages of numerous solid particles ranging in size from 1μm to 10⁴m. Examples include natural substances like sand, soil, coal, ores, drift ice, and snow; everyday items such as grains, sugar, salt, and pharmaceuticals; as well as industrial materials like coal and ores in production and technology. Bulk cargo transportation, tectonic plate movement, and vehicular traffic flow are also frequently treated as granular systems. Granular materials constitute one of the most abundant and familiar types of matter on Earth.
The peculiar behaviors of granular materials, particularly granular flows, have attracted significant scientific attention. "The Kinetic Theory of Granular Flow" was listed among the 125 major scientific questions by the American journal Science. Deepening the understanding and investigation of the motion laws and intrinsic nature of granular materials holds substantial scientific and practical significance. In recent years, numerous scholars have extensively studied the flow behavior of granular materials; however, fundamental theories describing their motion principles remain unestablished. Therefore, experimental exploration of these laws is essential.
Based on the hourglass timing principle, we experimentally investigated flow rate variations under conditions of different particle diameters, orifice sizes, and inclination angles in funnels. Drawing on related literature regarding 2D granular flow behavior, we established requirements for steady flow rates relative to orifice diameter, tilt angle, and particle size, while providing qualitative interpretation of experimental phenomena. Utilizing experimental results, relationships between flow rate versus funnel inclination angle and particle size in 3D configurations were fitted using Matlab software.
2.Experimental Setup and Methodology
Primary experimental instruments: electronic scale, automated data acquisition system, funnel. The main materials were dry particles of various sizes, obtained using standard sieves with average diameters of: 0.5, 0.9, 1.4, 2.0, and 2.7 mm. Funnel inclination angles (angle between funnel axis and inclined surface) were set to: 15°, 20°, 25°, 30°, 35°, 40°, 45°, 50°, 55°, and 60°. Funnel orifice diameters were: 8.00, 12.00, and 16.00 mm.
The funnel was mounted on a fixed stand while the collection basin was placed on the electronic scale. After zeroing the scale and preparing all materials, the funnel orifice was closed and particles were poured into the hourglass. Computer software was launched, and data acquisition initiated by clicking the start button. Simultaneously, the funnel orifice was opened, allowing particles to flow out while the software recorded mass data in real-time.
Experimental sequences:
⑴For *d* = 0.5 mm and D = 8.00 mm: 10 datasets collected at 5° intervals from 15°to 60°;
⑵Fixed *d* = 0.5 mm, D = 12.00 mm: 10 datasets across same angular range;
⑶Fixed *d* = 0.5 mm, D = 16.00 mm: 10 datasets → flow rate vs. orifice diameter curve;
⑷Variable particle diameters (0.9, 1.4, 2.0, 2.7 mm) at fixed D and θ → flow rate vs. particle diameter curve。
3.Results and Discussion
3.1.Particle Clogging Phenomenon
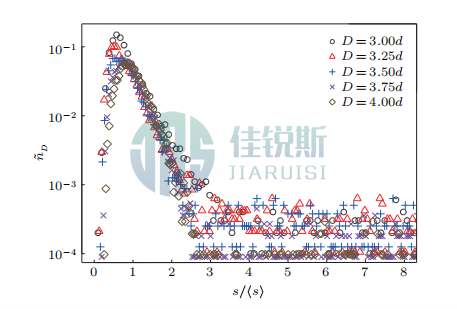
During orifice clogging, particles form arch-shaped structures—termed particle arching. This phenomenon depends on two factors: particle diameter (*d*) and orifice diameter (D). Based on 2D granular flow studies where flow rate Q=aD³/2, the *D/d* ratio emerges as a critical parameter for clogging. Controlled experiments with variable orifice diameters yielded relationships between *d* and D for: Clogging occurrence and Slow granular flow(Detailed in Tables 1–2)
Table 1 Values of D and d at Clogging
|
D/mm |
d/mm |
|
7.81 |
2.0 |
|
11.30 |
2.7 |
|
25.24 |
7.1 |
Table 2 Values of D and d During Slow Outflow from Funnel
|
D/mm |
d/mm |
|
9.60 |
2.0 |
|
12.10 |
2.7 |
|
27.24 |
7.1 |
By varying particle diameter and funnel orifice dimensions, the relationship curves between particle diameter and orifice diameter during clogging and flow states were obtained. As shown in Fig. 2, during clogging, the slope of the curve corresponds to critical D/d ratio of 3.51; during free flow, the slope corresponds to D/d = 3.75.

Fig. 2 Clogging Demarcation Curve
3.2Relationships Among Particle Diameter, Orifice Size, Granular Flow Rate, and Funnel Inclination Angle
Based on fundamentals of fluid dynamics, flow rate is defined as the quantity of fluid passing through a given cross-section per unit time. When expressed as mass flow, termed instantaneous mass flow rate (hereafter mass flow rate), the granular flow rate Q is defined as the ratio of mass increment Δm to time increment Δt in Fig. 3:
Q=dm/dt (1)
Table 3. Granular Mass Flow Rates at Different Inclination Angles
|
θ/(°) |
Q/(g·s⁻¹) |
θ/(°) |
Q/(g·s⁻¹) |
|
20° |
70.24 |
45° |
72.63 |
|
25° |
88.12 |
50° |
54.58 |
|
30° |
87.79 |
55° |
66.10 |
|
35° |
80.11 |
60° |
55.96 |
|
40° |
69.43 |
|
|
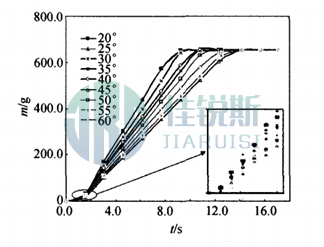
Fig. 3. Mass Flow Rate Curve for *d*=0.5 mm, D=16.00 mm
The overall trend shows decreasing flow rate with increasing inclination angle. This occurs because larger inclination angles reduce the gravitational force component along the inclined plane, slowing particle velocity. Additionally, irregular perturbations appear at the curve's onset (Fig. 3), caused by operational disturbances during baffle removal. Subsequent analyses exclude these artifacts.
When particle diameters are increased to 0.9, 1.4, 2.0, and 2.7 mm, the slope of mass flow curves decreases with larger *d*, indicating reduced flow rates. Key observations:
⑴ The 35° curve exhibits a smaller slope than 40° due to intermittent flow oscillations, attributed to air convection within particle interstices altering flow velocity.
⑵ All curves beyond 35° display oscillations, suggesting a shift in collapse mechanisms: small-angle collapse transitions to large-angle collapse at this critical angle, indicating competitive interaction between two distinct collapse regimes.
Maintaining constant θ and D while varying particle diameters yields Fig. 4. Larger particles correspond to decreased curve slopes (reduced flow rates), resulting from enhanced interstitial laminar air layers and increased viscous damping.
Fig. 4. Flow Rate Curves for Different Particle Sizes (D=16.00 mm, θ=15°)
3.3Analysis of Experimental Results Using Matlab Software
For the relationship between granular flow rate and inclination angle θ, we reference Da-vidson's formula for 2D funnel granular flow. Da-vidson proposed that for smooth-walled inclined funnels, flow rate Q is given by:
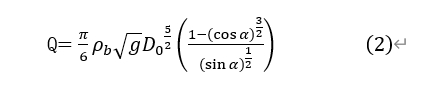
where:
Q:Granular flow rate
D0:2D funnel orifice diameter
α:Funnel inclination angle
Fig. 5. Flow Rate vs. Inclination Angle Fitted by Matlab,The fitted relationship is:
Q
where C is a constant. Coefficients *a* and *b* were derived for particle diameters *d* = 0.5, 0.9, 1.4, 2.0, and 2.7 mm.
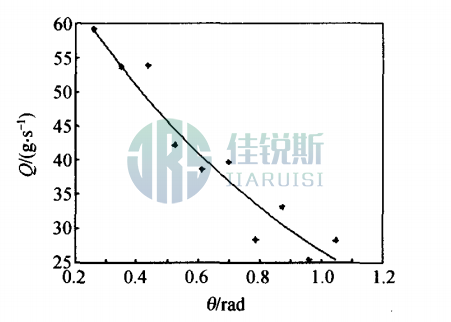
Figure 5 Fitting curve of inclination angle (θ/rad) vs. flow rate (Q/g·s⁻¹) at granule size 2.7 mm
Table 4. Coefficients a and b vs. Particle Diameter d at Fixed Inclination
|
d/mm |
a |
b |
|
2.70 |
-1.08 |
4.36 |
|
2.00 |
-0.87 |
4.41 |
|
1.40 |
—0.72 |
4.54 |
|
0.90 |
-0.69 |
4.60 |
|
0.50 |
—0.65 |
4.70 |
Fitting *a* and *b* versus *d* via Matlab yields:
a = -0.19d - 0.51
b = -0.16d + 4.76
As derived in Eq. (4), coefficients a and b for d=2.7 mm, the flow rate-inclination relationship is:
Q
Substituting these into Eq. (4) gives Q vs. *d*:
Q=C
Comparing Davidson's 2D model (Eq. 2) with the 3D formulation (Eq. 5) in Fig. 6, the 2D fitting curve exhibits greater curvature than the 3D curve. The 3D curve shows minimal curvature – flow rate depends near-linearly on inclination over θ = 0.2-1.0 rad. This indicates 3D funnels better satisfy timing device requirements than 2D configurations.
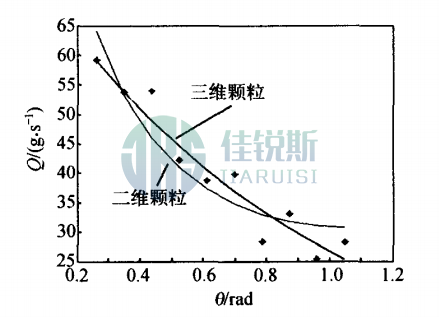
Figure 6 Comparison of fitting curves for two-dimensional granular flow rate and three-dimensional granular flow rate at granule size 2.7 mm
Conclusion
This experiment only considered the factors of granule size, funnel orifice diameter, and inclination angle in 3D funnel timing. By comparing the experimental results, the following conclusions were obtained: When the granule diameter, funnel orifice diameter, and funnel inclination angle have appropriate values, a stable granular flow can be obtained; When the granule diameter and funnel orifice diameter remain constant and the funnel inclination angle increases incrementally, the granular flow rate decreases as the inclination angle increases. This indicates that granules flow out of the funnel under gravity. As the funnel inclination angle increases, on the one hand, the component of gravity along the funnel slope decreases, slowing down the flow velocity; on the other hand, electrostatic friction between the granules and the inclined surface causes granules to adsorb at the interface, leading to an overall slowdown of the flow velocity. When the funnel orifice diameter and funnel inclination angle remain constant, the granular flow rate decreases as the granule diameter increases. Using Matlab to fit the experimental results shows that when the granule size and funnel orifice are fixed, the flow rate changes exponentially with the inclination angle; The collapse mechanism of granules in 2D and 3D funnels directly affects the flow rate relationship. The curvature of the fitting curve for 3D granules is very small, being closer to linear, meaning 3D funnels more readily satisfy the basic conditions for timing devices compared to 2D funnels. The granular flow exhibits unstable flow characteristics both at the beginning and the end. Therefore, when utilizing granular flow as a timing tool, measures must be taken to minimize boundary effects (i.e., the beginning and end). The critical relationship for arch blocking is determined by the ratio of funnel orifice diameter to granule diameter (D/d).